02/21/2019
The Milwaukee Bucks (43-14) have the best record in the NBA, rank fifth in offensive efficiency, first in defensive efficiency and lead the league in point differential (+9.8).
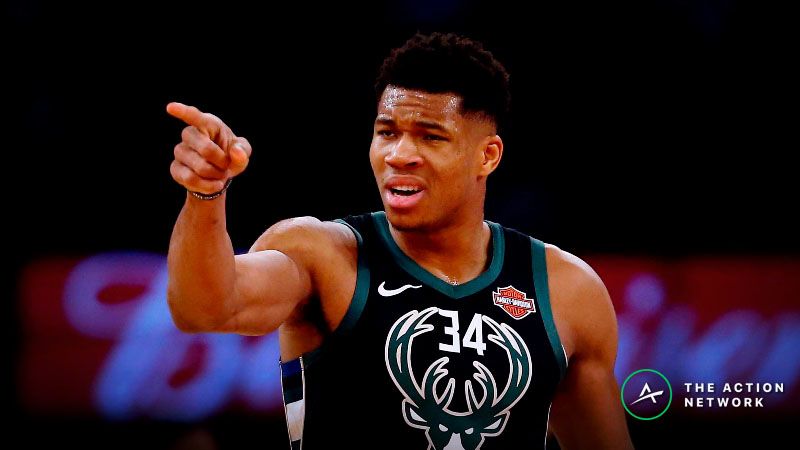
All-Star Giannis Antetokounmpo (+170) is one of the favorites to win the NBA MVP and at +1000 odds, there is valuing betting the Bucks to win the NBA championship.
The team’s success hasn’t been limited to the hardwood. At the All-Star break, no team in the NBA has been more profitable against the spread (ATS) than Milwaukee. Giannis & Co. are 34-20-3 (63.0%) ATS. A $100 bettor would have returned a profit of $1,209 wagering on the Bucks each game this season.
Milwaukee received 50% or more of spread tickets in 48 of 57 games to start the season. Mike Budenholzer’s team will host the Boston Celtics on Thursday (8 p.m. ET, TNT). The Bucks will be a popular bet but can the team continue to cover after the All-Star break?
To answer that question, I used the Bet Labs database to pull the pre and post All-Star ATS records for every team over the past five seasons. Then I used the correlation coefficient to determine if there was a relationship between a team’s ATS record before and after the break.
A correlation coefficient of 1 indicates perfect correlation, -1 means there is perfect negative correlation and 0 indicates no correlation.
The correlation coefficient between a team’s pre-All-Star ATS record and its post-All-Star ATS record is -0.002. This means there is no correlation and bettors should not expect the Bucks to continue covering the number better than 60% of the time.
Against-the-spread regression
It is rare for a team to have an ATS win percentage of 60% or greater before the All-Star break like the Bucks. Approximately 6% of teams in our database covered the number at that rate before the break. You might think great teams like Milwaukee can continue their winning ways, but you’d be wrong.
All teams that covered 60% or greater ATS before the All-Star break (average of 63.0% ATS) covered only 47.3% of games after the break.
Regression comes for the worst teams as well. This is good news for the Phoenix Suns who have gone 25-34 (42.4%) ATS, the least profitable team in the league this season.
In the past five seasons, teams that covered 40% or less before the All-Star break (average among the teams was 38.0% ATS) managed to hit 54.1% ATS after the All-Star Game.
Many factors contribute to this ATS regression but the primary influence is adjustments made by the oddsmakers. Sportsbooks know which squads the public wants to bet on and against.
The bookmakers then inflate the lines accordingly, making it more difficult for good ATS teams to cover and easier for bad ATS teams to get to the ticket window.
With the second half of the NBA season tipping off, remember that a team’s ATS record is not predictive. Regression is coming for the best and worst ATS teams in the league.
This article was originally posted on ActionNetwork.com by John Ewing. Sports Insights is part of The Action Network.
Source: https://www.sportsinsights.com/blog/nba-betting-system-nba-all-star-break-regression-bucks/