Written by Drew Borland of SportSource Analytics
In Part 1 of this topic we revealed how betting markets are very similar to stock and equity markets. We identified ways to assess team performance, volatility, and market value game to game. Here, we’ll break down how to assess and categorize each team on a week-to-week basis helping form a quantifiable value at a macro level before considering a drill down into the micro level (injuries, advanced statistics, box scores, etc.).
Subscribe and Listen to Bet the Board’s NFL and College Football Weekly Podcasts
Identifying Overachievers and Underachievers
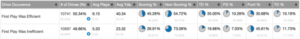
As we’ve mentioned in previous articles, trends like “5-1 ATS their last 6 games” are simply gambling content fodder more than predictive metrics. A team can be doing really well against the spread but at the same time oddsmakers can also be assessing their value accurately. One team that fits these parameters is Charlotte. The 49ers are 4-1-1 ATS this season. Their covers are by +0.5 points, +4.5 points, +8.5 points, and +9.5 points. Their sole ATS loss was -7 against the number. This team isn’t trending “hot” at all. They just happen to be barely landing on the right side of the final number.
Place all your Football Bets and more at Fanduel.com/BetTheBoard
Noise in the figures
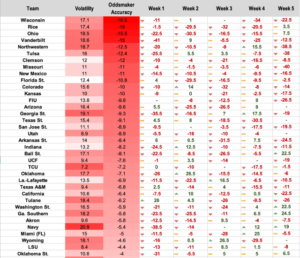
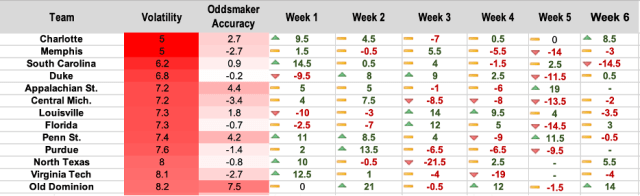
Additionally, you can clearly see the fallacy with their “ATS Trends”. Charlotte had a push and a cover by +0.5 points. That 4-1-1 ATS could easily be 3-3-0 depending on what number you had access to when placing the bet. Rather than obsess over ATS record, let’s instead focus on the quantitative measurement of average distance from final line (a.k.a Oddsmaker Accuracy). We want to know not only who is covering but by how much. Let’s look at the real overachievers:
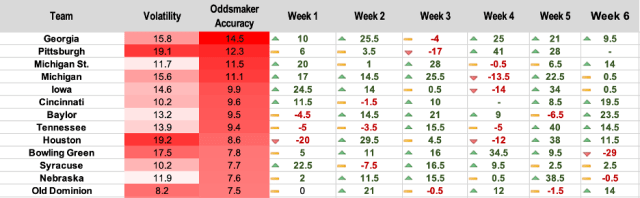
In the table above, we are sorting teams by how much oddsmakers are “undervaluing” certain teams on average. These are the top overachievers. Note that not all teams on this list are high profile programs leading to countless betting opportunities flying under the radar.
Follow Bet The Board on Twitter ?
@BetTheBoardPod – twitter.com/BetTheBoardPod
Follow the Hosts ?
@ToddFuhrman – twitter.com/ToddFuhrman
@Payneinsider – twitter.com/PayneInsider
Here’s a list of our underachievers.
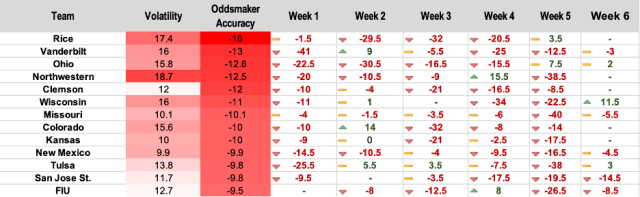
NOTE: Focusing on the Top 10% (13 teams) in FBS College Football.
This list has teams posting disappointing seasons well below oddsmaker expectations.
Making Information Actionable
How do we use this information? First, the overachiever/underachiever value is a combined season average. A bettor must take into account the trends within the overachiever/underachiever’s season. Did the stock peak or is it still rising? Before the opening lines come out for the following week, a bettor should immediately start the assessment of the overachieving teams from the previous week. Are they still healthy/intact? These are the hot stocks you may want to move on early anticipating market movement.
Continue the short or buy low
On the flip side, underachievers are teams you may want to consistently look to fade as long as they’re not playing another underachiever. Unfortunately when matched up against a solid overachiever, oddsmakers are in a bind not sure how much a price will move towards the “buy” side and away from the “sell.”
However that brief synopsis is an oversimplification. There is a deeper layer to this type of analysis that adjusts the spread result and oddsmaker accuracy for subjective reasons. For example, Notre Dame scored 14 points in the final 2 minutes of the Wisconsin game in Week 4. You can prune those points off the totals when doing analysis like this if you believe fluke points aren’t representative value of the team’s spread performance.
Adjusting a data set
We also endorse removing games completely if there was an extenuating circumstance that prevented the game from being played as intended (Quarterbacks getting injured is the most common). In previous articles, we also analyzed Special Teams + Defensive Touchdowns, Red Zone turnovers, and variety of other rare occurrences that can inject a lot of variance into spread outcomes. These factors add noise to the big picture and should be filtered out subjectively.
Inherent Volatility
Next up is measuring Volatility. This one is a bit more straightforward. While most people love roller coasters, I assure you that this is not a ride you want to be on when it comes to betting. Volatility is measured by the average distance from the spread regardless of direction. If the direction is consistently up, teams are classified as overachievers. If teams are consistently down, they fall into the underachiever bucket. Although both of those situations can be advantageous trends to track/bet, teams that are both erratically up and down on the spread are not.
Exhibit A is USC for a team riding an unpredictable wave.
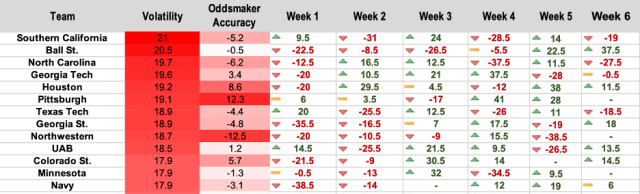
Tracking the Trojans
USC was up, down, up, down, up, down. Clay Helton was fired mid-season and that explains a lot pre and post-firing. When assessing value, volatility as extreme as USC (as well as North Carolina and UAB), should tell the bettor that there are clear, non-traditional factors at play preventing oddsmakers from getting a good read on the situation.
Volatility means opportunity
That said, some really sharp bettors (and investors) view volatility as opportunity. I think there is an argument for trying to make sense of what oddsmakers simply cannot. Finding that opportunity/value will require digging into and breaking down each game to look for situational and matchup anomalies. These can help explain why volatile teams have games that go completely sideways.
On the opposite side of the spectrum from highly volatile teams are more stable sides in the eyes of the market.
These are the teams that oddsmakers (and the market) are evaluating accurately. Does non-volatility have value? An argument can be made both ways. The one pitfall is when two non-volatile teams play one another. The problem there is that when oddsmakers know both teams really well, the line generally has that “spot on” feeling for bettors and is best to avoid rather than flipping coins.
In summary, evaluating teams through market performance and market factors is a sound approach to finding teams to buy/bet at a macro level. Like stocks, there are overachieving blue chips you want to buy like Apple, Amazon and Google, there are underachievers you’ll want to avoid like Sears and Kodak, and there are highly volatile teams like cryptocurrencies.
Regardless of the teams in which you place your stake week-to-week, understanding these dimensions and the quantifiable trends are crucial to understanding how the market is performing and where there might be underlying line value.