The price of Stacks (STX) is moving above an important resistance area and is creating its eighth successive weekly bullish candlestick.
The increase starkly contrasts the altcoin market, which suffered a significant correction during the past three days.
Stacks (STX) Moves Above $1.80
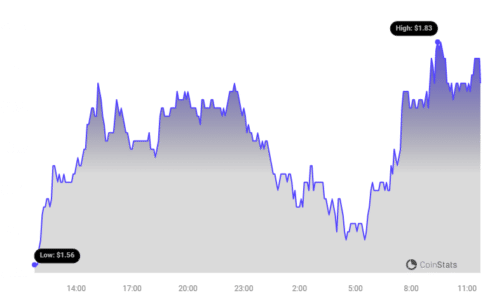
The Stacks price has increased significantly since the end of November 2023. The upward movement has been swift, with no pullback observed whatsoever.
Last week, STX experienced a flash crash, which was also seen in the rest of the cryptocurrency market.
However, the price created a very long lower wick (green icon), validating the previous resistance as support. Then, it closed the weekly candlestick bullishly and resumed its increase this week.
So far, STX has reached a high of $1.83, the highest price since March 2023.
The RSI is a momentum indicator traders use to evaluate whether a market is overbought or oversold and whether to accumulate or sell an asset.
Readings above 50 and an upward trend suggest that bulls still have an advantage, while readings below 50 indicate the opposite.
The weekly RSI is increasing and above 50, which are signs of a bullish trend. Even though the indicator is in overbought territory, there is no bearish divergence to warn of an impending decrease.
See Also: Binance Announced The Listing Of This Altcoin, Triggering Increase In Price
Price Prediction: Is $2 Next?
While the weekly time frame is conclusively bullish, there are signs of weakness in the daily time frame, which cast doubt as to whether the upward trend will continue.
Firstly, the STX price has traded inside an ascending parallel channel for 20 days. Such channels usually contain corrective movements, meaning that a breakdown from the pattern will be the most likely scenario.
Also, the daily RSI has generated a bearish divergence (green line).
However, these signs are not definitively a verdict that the STX price will break down.
This is because Stacks has made numerous attempts at breaking out, weakening the channel’s resistance trend line. Also, the bearish divergence trend line is close to breaking.
See Also: US SEC Warns Against FOMO On Bitcoin Spot ETFs
So, if the STX price breaks out from the channel, it can increase by another 35% and reach the next resistance at $2.40.
Despite this bullish STX price prediction, a breakdown from the channel can cause a 30% drop to the closest support at $1.20.
Disclaimer: The information provided is not trading advice. Bitcoinworld.co.in holds no liability for any investments made based on the information provided on this page. We strongly recommend independent research and/or consultation with a qualified professional before making any investment decisions.
Mercari Ecommerce Platform To Accept Bitcoin Payments
Bitcoin, Ethereum, and Dogecoin See Price Downturn; InQubeta
- SEO Powered Content & PR Distribution. Get Amplified Today.
- PlatoData.Network Vertical Generative Ai. Empower Yourself. Access Here.
- PlatoAiStream. Web3 Intelligence. Knowledge Amplified. Access Here.
- PlatoESG. Carbon, CleanTech, Energy, Environment, Solar, Waste Management. Access Here.
- PlatoHealth. Biotech and Clinical Trials Intelligence. Access Here.
- Source: https://bitcoinworld.co.in/the-price-of-stacks-stx-moved-above-1-80-today-retracing-all-its-decrease-from-january-3/
- 20
- 2023
- 40
- 50
- 8
- 80
- a
- above
- accept
- accumulate
- ADvantage
- advice
- Against
- All
- also
- Altcoin
- an
- and
- announced
- Another
- any
- ARE
- AREA
- as
- asset
- At
- attempts
- based
- BE
- bearish
- because
- been
- before
- below
- Bitcoin
- BitcoinWorld
- break
- Breakdown
- Breaking
- breaks
- Bullish
- Bulls
- by
- CAN
- category
- Cause
- channel
- channels
- chart
- chief
- close
- closed
- CO
- compliance
- consultation
- contain
- continue
- contrasts
- Crash
- created
- Creating
- cryptocurrency
- cryptocurrency market
- daily
- days
- decisions
- decrease
- Dogecoin
- Doubt
- down
- downturn
- Drop
- During
- ecommerce
- embraced
- end
- ethereum
- Evaluate
- even
- experienced
- far
- Flash
- FOMO
- For
- Frame
- from
- generated
- Green
- has
- Have
- High
- highest
- holds
- Honduras
- HTML
- HTTPS
- ICON
- if
- impending
- important
- in
- Increase
- increased
- increasing
- Independent
- indicate
- indicator
- information
- INSIDE
- investment
- Investments
- Is
- IT
- ITS
- January
- jpg
- liability
- likely
- Line
- listing
- Long
- made
- Making
- March
- Market
- meaning
- Momentum
- most
- moved
- movement
- movements
- moves
- moving
- New
- new Chief
- Next
- no
- not
- November
- numerous
- of
- Officer
- on
- opposite
- or
- out
- page
- parallel
- Past
- Pattern
- platform
- plato
- plato data intelligence
- platodata
- platogaming
- prediction
- previous
- price
- Price Prediction
- professional
- provided
- pullback
- qualified
- reach
- recommend
- research
- resistance
- REST
- rsi
- scenario
- SEC
- see
- seen
- sell
- significant
- significantly
- Signs
- since
- source
- Spot
- still
- strongly
- such
- suffered
- suggest
- support
- SWIFT
- tag
- territory
- that
- The
- then
- there
- These
- this
- though
- three
- time
- to
- Today
- traded
- Traders
- Trading
- trend
- tutorial
- us
- use
- usually
- validating
- very
- was
- we
- weakness
- week
- weekly
- whether
- while
- will
- with
- zephyrnet