In recent years the big esports, and MOBAs especially, have gone moneyball on us. Meaning, they’ve added analysts and started crunching numbers to help guide their approach to the game. Far from the exception, we (Team Liquid) were one of the orgs that helped make this norm, through our partnership with SAP — one of the world’s largest software and data processing companies.
But how much do you, or any of us, understand the role of data in esports?
If you’re like me, then you understand the nebulous concept of data being an important part of esports — and not much more. Sure, everyone can understand basic statistics, kills, deaths, assists, pick rates, ban rates, all the stuff you see on broadcast. But data analysis in esports goes much further than the numbers that we see on the broadcast. In fact, it’s the simplicity of what you see on broadcast, of the digestible stuff, that can lead to misconceptions about the whole field.
“Maybe some of the misconceptions … are because a lot of the data that’s easy for the fans to look at is made for them.” This comes from Haitham “Haitham” Algbory — the analyst for Team Liquid Honda, AKA our League of Legends team. “[The broadcast stats are] made to make them understand and enjoy analysis, but that’s not necessarily what we use with the teams. We go more in-depth, and we go more efficient and insightful.”
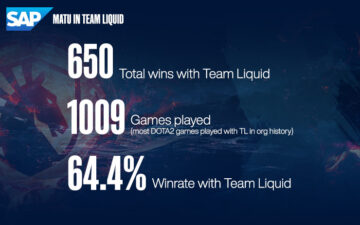
To explore that depth, I also spoke with our primary analyst for Team Liquid Dota, Mathis “Jabbz” Friesel. That way, I could see what changes and what stays the same across the genre’s two heavy-hitters. For Jabbz and Dota, the flashy data is often overrated and what’s more important is efficiency.
“A lot of the time, you don’t need the most complicated data or the most flashy data,” Jabbz said with regards to common misconceptions about data held by esports fans. “Sometimes, just the fact that you can be extremely efficient is super helpful in our industry, because when you’re at a tournament, you generally don’t really have that much time to go super in-depth. So having tools to make everything more efficient and save time is a big plus.”
That efficiency is something Team Liquid achieves with the help of SAP, our data partner for years now. A big part of what SAP brings to TL is the SAP HANA Cloud — a database program that makes data analysis in both League of Legends and Dota a lot easier. The database allows our analysts to focus less on gathering data and more on analyzing it. Both Jabbz and Haitham have been working in this field for a long time, and there are things that they can do now that they never could before, thanks to this tool specifically made for esports data analysis.
[embedded content]
(SAP and TL have been partners for 5 years now, stretching all the way back to the Kuro core.)
“I support both the General Manager and the coaching staff with scouting new talent,” Haitham said. “The way I do that is by providing periodic solo queue and scrim reports and end-of-season scouting reports. When it comes to the Academy teams of the East Regions, at the same time, we just track the players that are in the scene in general and we see their improvement based off the metrics that we have set in our tools.” On the League side, the SAP HANA Cloud is Haitham’s primary tool for scouting. But that’s not what Jabbz uses the data for. For Team Liquid Dota, the data is more match-focused.
“For us, the SAP HANA Cloud has more of a different function,” Jabbz said. “We use it mostly for performance-related things. I think the big advantage we have with the Cloud is that we can actually import any public game that we want to. Let’s say things have changed in a recent patch, so we can make sure that we’re always up to date with how the meta is evolving. We also get to have a replay of every tournament game, so we can pick up all the information we need from any game, especially during live events. This is incredibly helpful. By having this tool available, you can quickly see how teams are adapting, how teams are thinking, and I save a lot of time getting that information, whereas before, I would have to open up the replays in the game and manually scroll through everything.”
Though the League squad applies more data in scouting, Haitham notes that they also benefit from having a database of, “pretty much every draft that has ever happened in competitive [League].”
“We’re able to analyze the strengths and weaknesses, and we also are able to connect the draft with the performances in-game with the metrics that we have,” Haitham told me. “So we’re able to understand if what we had was a fluke from a draft or was actually supported by the data that we have.”
Though League of Legends and Dota 2 are different games in key ways, leading to entirely different data use cases, they’re also very similar in others. Both are MOBAs where pattern recognition and map awareness are part of the core gameplay, which means there’s plenty of overlap in data analysis as well. Until our conversation, Haitham and Jabbz seemed to be aware of the similarities between their games, but didn’t know exactly how similar their processes were until they shared them with each other.
“I spoke to a League of Legends player from our team, Alphari, back in the day,” Jabbz said. “We spoke about concepts and a lot of concepts from Dota and League actually aligned, which makes sense considering the map is basically the same. I imagine vision and map movement would align the most, and drafts as well. I imagine there’s a lot of raw data to be pulled from these things and a lot of patterns that you can get from these things — at least for us, it’s the statistic you can do the most with.”
Haitham agreed and noted that the early game in particular was where the strongest, most repeatable patterns emerged. “When preparing for a match, I focus on the first eight to ten minutes. For the most part, that’s the most consistent way any team is going to perform. So at level one, where do they stand? Where do they drop their vision? Where do they go with their jungle movement? And with that we’re able to understand the type of opponent that we’re facing.”
“That’s funny,” Jabbz replied, building out the early game riff, “because we also have vision mostly in the first few minutes, because afterwards it gets a little too chaotic and the minute zero movement stuff were the exact same concepts. So, not surprised at all — the games are very similar — but apparently we came to the same conclusions.”
That may explain not only why both TL’s League and Dota team have both been known for their potent early games this year. It’s not just that data lends to that area, but also that the HANA Cloud database makes it much easier to prepare and then respond to that exact laning style that another team might run.
“Tracking patterns is a very big part of what we show the team,” Haitham said. “For example, here at Worlds, with the new format, we’re gonna have a very short time to scout opponents. Possibly less than 12 hours from the time the game ends. So there’s essentially no time to just go through the last 5, 10, 15 games to track patterns. But what we have with the SAP HANA Cloud is key metrics and a map tool that gives us information on what this team’s style is, what kinds of things we need to focus on, and we go to the match with that information.”
Both Haitham and Jabbz could point to specific instances where the data made it much easier for them, and their teams, to counter their opponents. For Haitham, the data helped Team Liquid Honda take revenge on Evil Geniuses and qualify for Worlds.
“Evil Geniuses were a team that would usually play around mid lane,” he said. “In the series we played them, they changed that approach to focus more around top lane. After the first game we started noticing that trend, so we tracked their movement, we tracked their patterns, and it was consistent with the second game as well. So I was able to help the jungler understand what should work to spot the opponent early on and where we can expect them to come top lane, and we were able to counter a lot of their map movement. That gave us a big edge to win that series.”
[embedded content]
(The data-based reads help to explain why Pyosik seemed to pick all the perfect spots in game 3.)
For Jabbz, the data systems helped him and his team navigate the dangers of Valve’s open circuits. A big difference in the MOBAs is that League is franchised, leading to repeated conversations often between the same in-region teams. In Dota, though, a challenger can rise up from open qualifiers and enter with entirely new dialogue. A lot of established teams get upset in these matches because they don’t know the words to come. Jabbz recalls how his data analysis made one such match feel scripted.
“Three years ago, we played an online tournament against a relatively new team,” Jabbz said. “We came to a conclusion that new teams had the big disadvantage of having a specific playstyle compared to more experienced teams. This one specific new team would always play the exact same way and I ended up finding that out, and when we played against them my players told me that it felt like they were playing a literal replay of what I just told them before the match.”
Even when the analysts get it right, it can still be hard to convince the players to get on board. After all, these players have plenty of accolades of their own and plenty of reason to trust their own gut over the numbers. SAP’s built-in visualization tools make it much easier for analysts to deliver information to, as well as convince, the rest of the team.
“It’s a big point, trying to convince your team and your players,” Jabbz said. “The information has to be easily digestible to convince your team of a point you want to make. So for us, the SAP HANA Cloud has features that let you export images and graphs. What I usually do is I end up making a document and a printout. The export function helps a lot for me to quickly design printouts with all the necessary information that I can give people physically, on paper, at a LAN.”
According to Haitham, being able to use real gameplay clips to corroborate the data — and vice versa — often helps build a stronger case for whatever argument he’s trying to make. Players are more inclined to believe the data once they have a reference point, which then allows them to gain a deeper understanding of the game.
“With SAP, we have a lot of good [visualization] tools,” Haitham said. “We have an entire map tool that will just visualize to us where the wards are and what the movement is looking like. We have a tool [called SAP Analytics Cloud] that gives us an opportunity to build charts and graphs for the players. I would use videos or clips that are important to show the opponent’s style, and then I support that with the maps or graphs from the SAP tool.”
For some, all these details might sound small, even insignificant. However, any coach or analyst will tell you that at the highest level of esports, the difference lies in the details. When pretty much every player is equal in skill, it’s those minor advantages that matter — which makes data analysis an important factor for success. After all, a close win is still a win; both Haitham and Jabbz point to “the small margins” as the reasons why they love their roles as analysts.
“Personally, I work on my own goal to help others achieve theirs at the same time,” Haitham said. “Seeing players are able to use science while playing video games, to beat opponents that they may not be able to without that kind of information… it just makes everything worthwhile.”
“I agree, I think it’s always very satisfying to give information to the guys that they wouldn’t pick up,” Jabbz added. “I guess we’re very similar in that regard — I also enjoy helping the guys and that’s what gives me the joy in this job. I don’t necessarily have to see myself in the limelight or at the front of the stage, but I really just like seeing my friends succeed.”

Writer // Bonnie Qu
Graphics // Zack Kiesewetter
- SEO Powered Content & PR Distribution. Get Amplified Today.
- PlatoData.Network Vertical Generative Ai. Empower Yourself. Access Here.
- PlatoAiStream. Web3 Intelligence. Knowledge Amplified. Access Here.
- PlatoESG. Carbon, CleanTech, Energy, Environment, Solar, Waste Management. Access Here.
- PlatoHealth. Biotech and Clinical Trials Intelligence. Access Here.
- Source: https://www.teamliquid.com/news/2023/10/10/sap-masters-of-data
- 10
- 12
- 15
- a
- able
- About
- Academy
- achieve
- Achieves
- across
- actually
- adapting
- added
- ADvantage
- advantages
- after
- afterwards
- Against
- ago
- agreed
- Aka
- align
- aligned
- All
- allows
- also
- always
- an
- analysis
- analyst
- analytics
- Analyze
- analyzing
- and
- Another
- any
- applies
- approach
- ARE
- AREA
- around
- as
- Assists
- At
- available
- aware
- awareness
- back
- Ban
- based
- basic
- BE
- beat
- because
- been
- before
- being
- believe
- benefit
- between
- BIG
- BIG Esports
- board
- both
- brings
- broadcast
- build
- Building
- built-in
- but
- by
- called
- came
- CAN
- case
- cases
- Challenger
- changed
- changes
- Charts
- close
- Cloud
- coach
- coaching
- come
- comes
- Common
- Companies
- compared
- Competitive
- complicated
- concept
- concepts
- Conclusion
- connect
- considering
- consistent
- content
- Conversation
- conversations
- Core
- could
- counter
- Credits
- dangers
- data
- data analysis
- Database
- date
- day
- deeper
- deliver
- depth
- Design
- details
- dialogue
- difference
- different
- different games
- digestible
- do
- document
- don
- DOTA
- Dota 2
- draft
- Drop
- During
- each
- Early
- easier
- easily
- East
- easy
- Edge
- efficiency
- efficient
- embedded
- emerged
- end
- ended
- ends
- enjoy
- Enter
- entire
- entirely
- equal
- especially
- esports
- Esports data
- esports fans
- Essentially
- established
- even
- events
- EVER
- Every
- everyone
- everything
- Evil Geniuses
- evolving
- exactly
- Example
- exception
- expect
- experienced
- explain
- explore
- EXPORT
- extremely
- facing
- fact
- factor
- fans
- far
- Features
- feel
- felt
- few
- field
- finding
- First
- Focus
- For
- format
- Friends
- from
- front
- function
- funny
- further
- gain
- game
- gameplay
- Games
- Gathering
- gave
- General
- generally
- Get
- getting
- give
- gives
- go
- goal
- goes
- going
- gone
- good
- guide
- had
- happened
- Hard
- has
- Have
- having
- he
- held
- help
- helped
- helpful
- helping
- helps
- here
- highest
- him
- his
- honda
- hours
- How
- however
- HTML
- HTTPS
- i
- if
- Images
- imagine
- important
- improvement
- in
- in-game
- incredibly
- industry
- information
- insightful
- Is
- IT
- Job
- just
- Key
- Kills
- kind
- know
- known
- LAN
- largest
- last
- lead
- leading
- League
- league of legends
- least
- Legends
- less
- let
- Level
- lies
- like
- limelight
- Liquid
- Little
- Live
- Long
- Look
- looking
- lot
- love
- made
- make
- MAKES
- Making
- manager
- manually
- map
- Maps
- Match
- matches
- matter
- May
- me
- meaning
- means
- Meta
- Metrics
- might
- minor
- minute
- minutes
- misconceptions
- more
- most
- mostly
- movement
- much
- my
- myself
- navigate
- necessary
- need
- never
- New
- no
- not
- noted
- notes
- now
- numbers
- of
- off
- often
- on
- once
- One
- online
- only
- open
- opponents
- Opportunity
- or
- Other
- Others
- our
- out
- over
- own
- Paper
- part
- particular
- partner
- partners
- Partnership
- Patch
- Pattern
- patterns
- People
- perfect
- perform
- Performances
- pick
- plato
- plato data intelligence
- platodata
- platogaming
- play
- played
- player
- players
- Playing
- Plenty
- Plus
- Point
- possibly
- potent
- prepare
- preparing
- pretty
- primary
- processes
- processing
- Program
- providing
- public
- quickly
- Rates
- Raw
- raw data
- RE
- Real
- really
- reason
- reasons
- recent
- recognition
- reference
- regard
- regards
- regions
- relatively
- Reports
- respond
- REST
- revenge
- right
- rise
- role
- roles
- Run
- s
- Said
- same
- sap
- satisfying
- save
- say
- scene
- Science
- scroll
- second
- see
- seeing
- seemed
- sense
- Series
- set
- shared
- Short
- should
- show
- side
- similar
- similarities
- simplicity
- skill
- small
- So
- Software
- Solo
- some
- something
- sound
- specific
- specifically
- Spot
- spots
- staff
- Stage
- stand
- started
- statistics
- stats
- still
- strengths
- stronger
- style
- succeed
- success
- such
- super
- support
- Supported
- sure
- Systems
- Take
- Talent
- Team
- Team Liquid
- TeamLiquid
- teams
- tell
- ten
- than
- thanks
- that
- The
- The Game
- their
- Them
- then
- there
- These
- they
- things
- think
- Thinking
- this
- those
- though
- Through
- time
- TL
- to
- told
- too
- tool
- tools
- top
- tournament
- track
- trend
- Trust
- trying
- two
- type
- Understand
- understanding
- until
- up
- us
- use
- uses
- usually
- very
- vice
- vice versa
- Video
- video games
- Videos
- vision
- visualization
- visualize
- want
- was
- way
- ways
- we
- well
- were
- What
- whatever
- when
- where
- whereas
- while
- whole
- why
- will
- win
- with
- without
- words
- Work
- working
- Worlds
- worthwhile
- would
- year
- years
- you
- your
- youtube
- zephyrnet
- zero